
Question
- Junior Cycle Science (Common Level) 2023: Q12
- Back to the question >
Answer
(a)
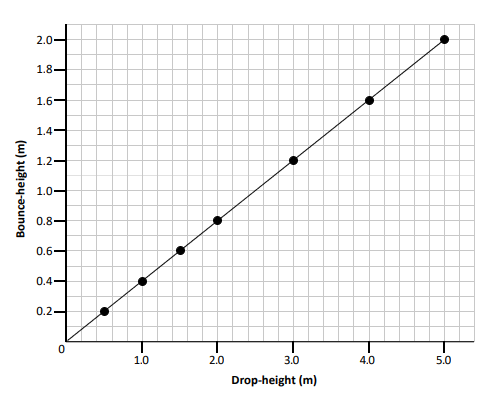
(b) Interpreting the graph: For every increase of 1 m of drop-height on the x-axis, there is a corresponding 0.4 m increase in bounce-height on the y-axis. From the graph, drop-height is directly proportional to the bounce-height. There is a straight line from the origin on the graph; therefore, as the drop-height increases the bounce-height will also increase. From a drop-height of 10 m, the ball should bounce to a height of 4 m.
(c) The drop-height is easier to measure as the ball is being dropped from a stationary position and therefore, is easier to measure.
(d) 1.6 m is easier to measure as the ball will bounce to a height that will allow time to read the bounce-height, and it is also a more visible reading to take.
0.2 m is a significantly smaller height and the bounce-height will be reached much quicker, resulting in a difficult to read smaller height and less time to observe the height reached.
(e) Wear safety googles to prevent the bouncing ball from hitting any student in the eye area.
(f) The ball is dropped from a stationary position; therefore, the energy conversion is from potential energy to kinetic energy.
(g) Yes, it is a testable hypothesis as an activity can be carried out and measurements can be taken to observe if the colour of the ball has any impact on the bounce-height reached. It may not show any difference in the results but the statement is testable.