Question
- Leaving Certificate Physics (Higher) 2021: Section A Q3
- Back to the question >
Answer
A student investigated how the fundamental frequency f of a stretched string varied with its tension T. The string was kept at a length of 65 cm.
The following data were recorded.

(i) Draw a labelled diagram of how the apparatus was arranged in this experiment.

(ii) Describe how the student used the apparatus.
Method:
- Set up the apparatus, as shown
- Select a wire length l (e.g., 30 cm), by suitable placement of the bridges. Keep this length fixed throughout the experiment.
- Strike a tuning fork and place it on the sonometer. Vary the tension until the string begins to vibrate.
- Repeat the procedure several times.
- Plot a graph of frequency f against the square root of tension
 .
.
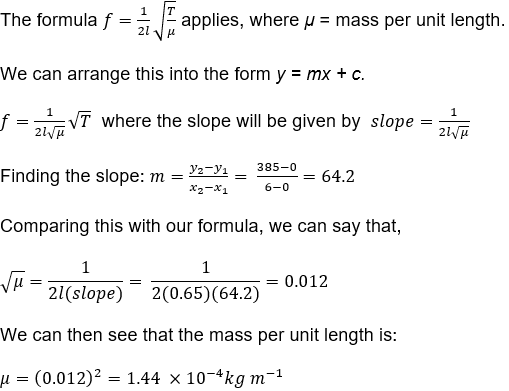
(iii) Draw a suitable graph to show the relationship between f and T.

(iv) Use your graph to calculate the mass per unit length (linear density) of the string.